Model evaluation
Method
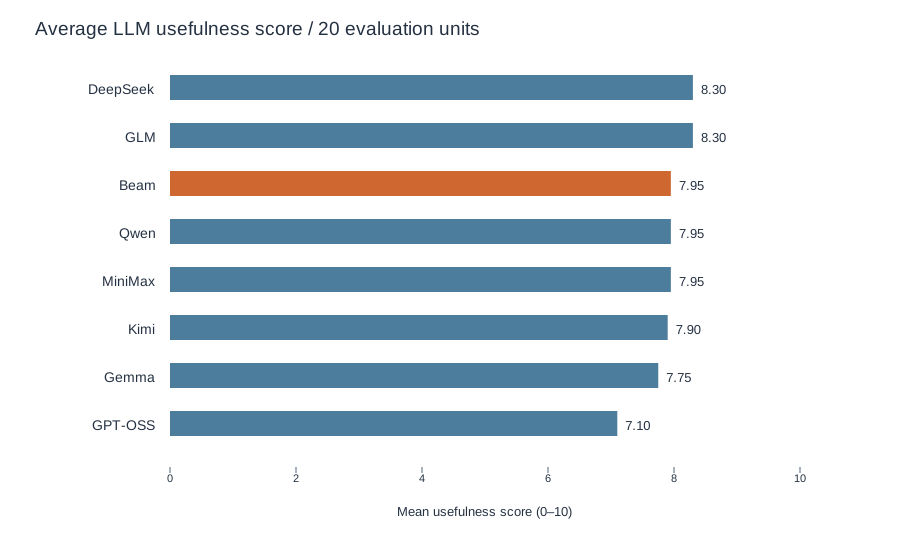
Eight models were compared across 20 scenario runs each (16 distinct case IDs, with four repeated). Each selected response received a 0–10 usefulness score from an LLM. Judges differ between models; results remain pending human review. A separate human/LLM comparison covered 12 selected responses, not a representative sample.
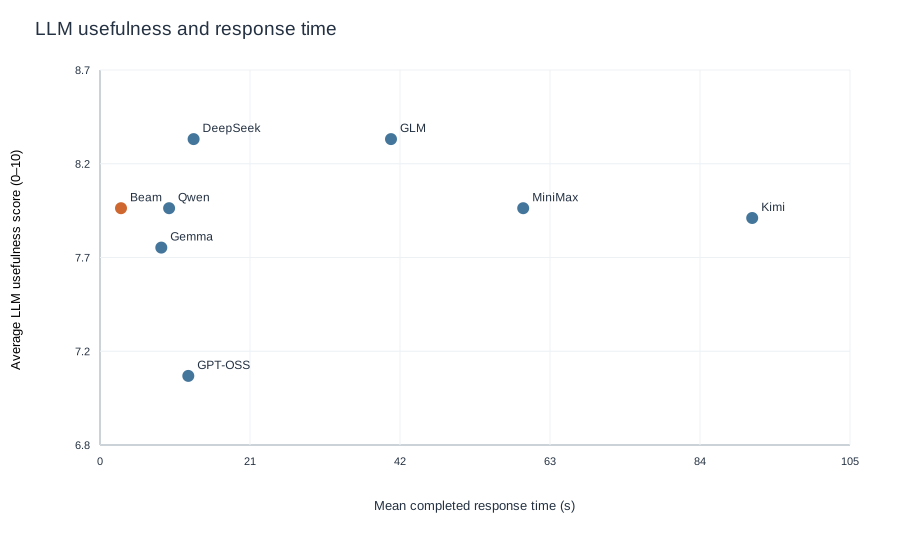
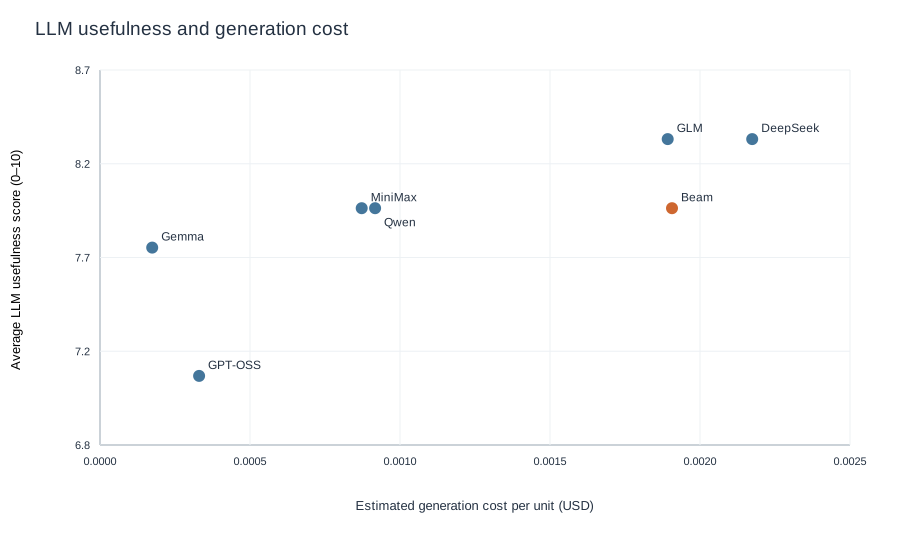
Completion after documented retries was 20/20 for each model. The table shows first-attempt completion separately. Response time is the elapsed time around one model invocation, including the API round trip and response handling; it is not isolated model compute time. The mean uses the selected completed response for each of 20 runs. It excludes time spent on earlier failed attempts and does not measure the full app workflow. Cost is an estimate for generation attempts; it excludes judge costs and may be unavailable.
| Model | LLM score / 10 | First attempt | Mean response time (s) | Estimated USD / run |
|---|---|---|---|---|
| Beam | 7.95 | 20/20 | 2.95 | $0.001870 |
| DeepSeek | 8.30 | 20/20 | 13.16 | $0.002132 |
| GLM | 8.30 | 17/20 | 40.93 | $0.001856 |
| Qwen | 7.95 | 20/20 | 9.72 | $0.000899 |
| Kimi | 7.90 | 17/20 | 91.71 | Not available |
| MiniMax | 7.95 | 20/20 | 59.52 | $0.000856 |
| Gemma | 7.75 | 20/20 | 8.62 | $0.000170 |
| GPT-OSS | 7.10 | 20/20 | 12.42 | $0.000324 |
Response time
Beam: 2.95 seconds on average across 20 completed responses (20/20 completed on the first attempt). These were requests for fictional support-planning scenarios, not the multi-step app flow. Other models’ means and first-attempt completion counts are in the table above. GLM and Kimi each had three initial failures that were retried; their averages cover only the selected successful responses and omit earlier waiting time. Provider, execution settings, parallelism and timing differed, so the numbers are not a controlled hardware-speed benchmark.
Limitations
Small score differences should not be treated as statistically significant.
- These scenarios and programs are fictional; 20 runs are not 20 independent cases.
- Different judge models, retries, output limits and timeouts limit direct comparison.
- Kimi has three attempts with unknown cost. Estimated costs omit the judging calls and are not the final bill.
- One person's comparison with LLM judgments on 12 selected answers found exact usefulness-score agreement in 2/12; it does not validate all scores.
- Raw model outputs and judge logs are not included in this export, so the scoring cannot be independently reproduced from these files alone.
Files
Case-level results (CSV, 160 rows) · Aggregated data and method (JSON) · Detailed report (Japanese)
Charts
Average usefulness scores · Score and response time · Score and estimated cost